Chart Room · Monthly Rotation

Monthly RRG Maps.
See where leadership is moving.

The monthly Relative Rotation Graph shows the market's internal leadership on one page: who is leading the S&P 500, who is improving, and where relative momentum is still breaking down.

August 2026 Report

Leadership is selective,
not broad.

Rotation is not just about whether the index is up or down. It shows where institutional leadership is building beneath the surface—and where it is still deteriorating.

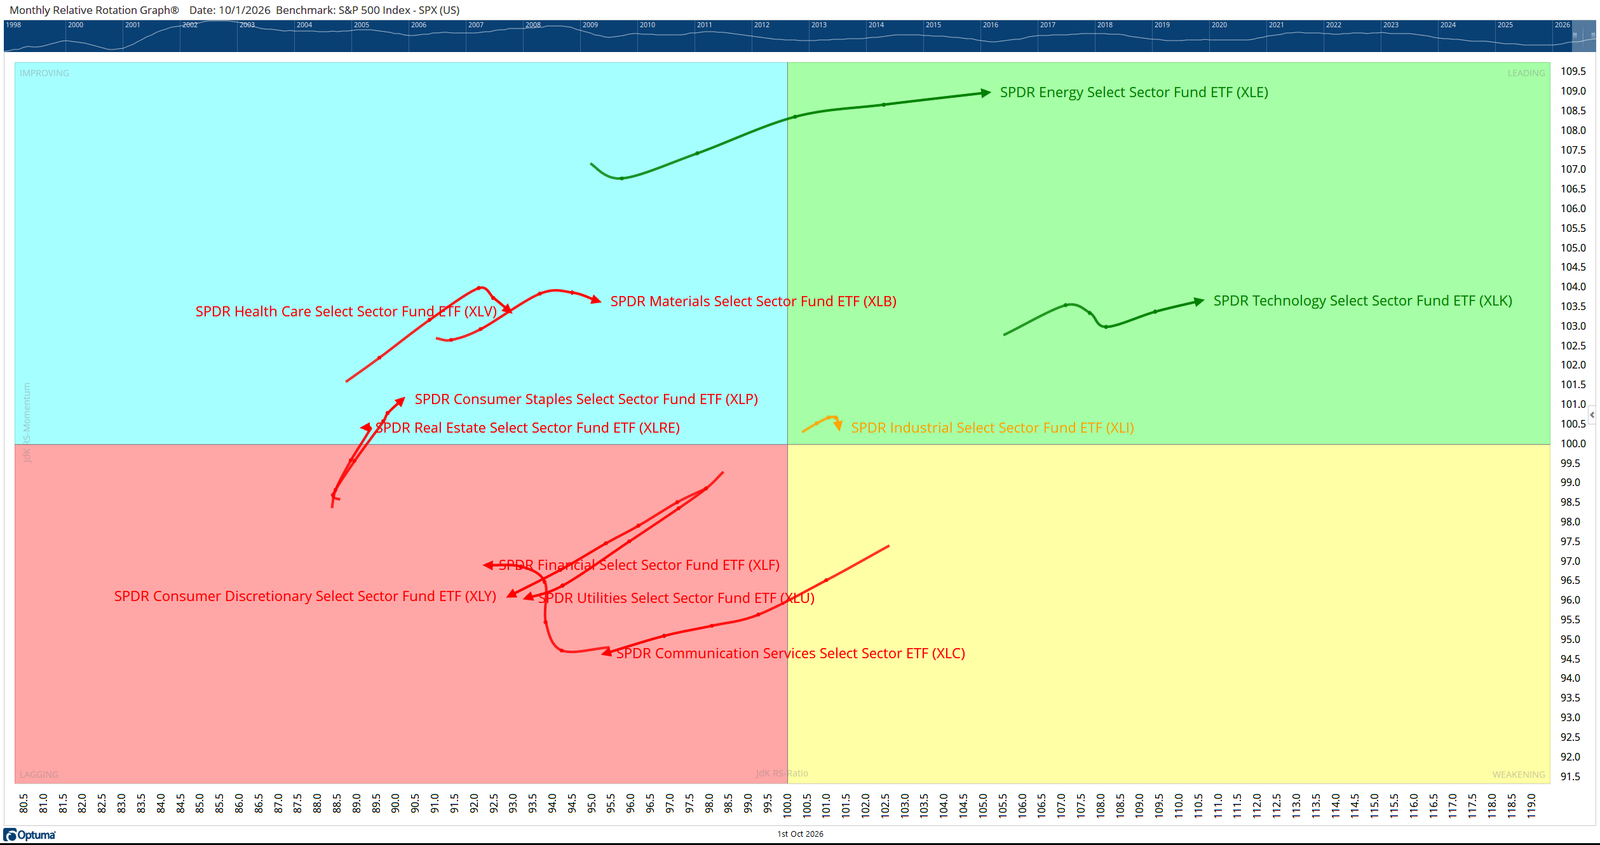
Monthly Relative Rotation Graph for the 11 S&P 500 sectors
11 S&P 500 Sectors

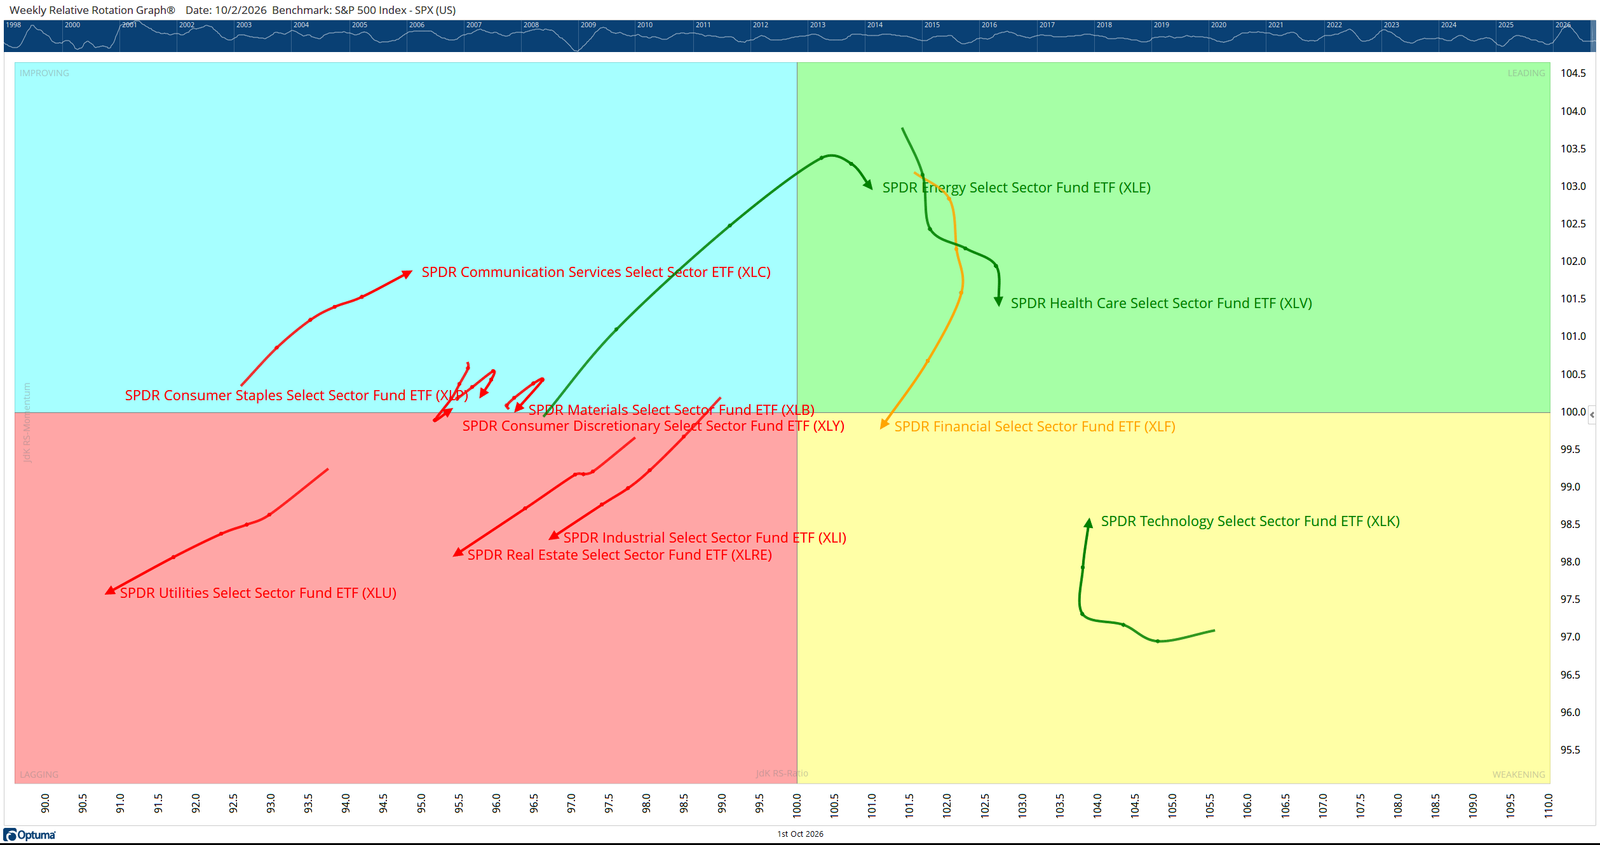
Leadership remains concentrated.

Technology is leading, Industrials are pressing into the leading quadrant, and Energy has the strongest improving trajectory. Health Care and Materials are improving. Financials, Real Estate, Staples and Utilities remain on the lagging side, while Consumer Discretionary and Communication Services are still weakening.

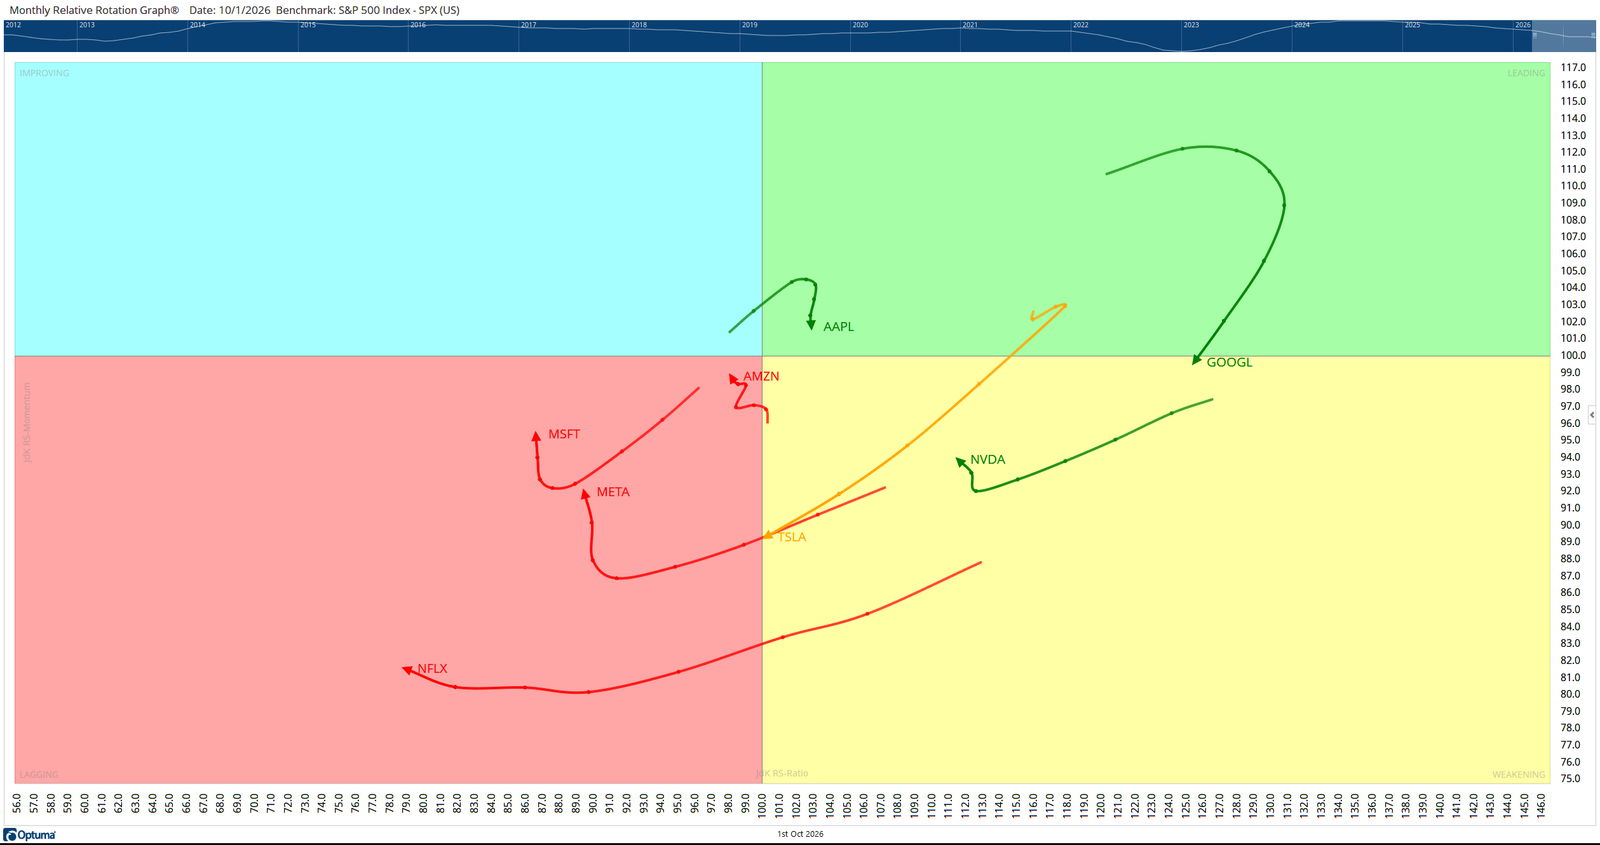
Monthly Relative Rotation Graph for the Magnificent 7
Magnificent 7

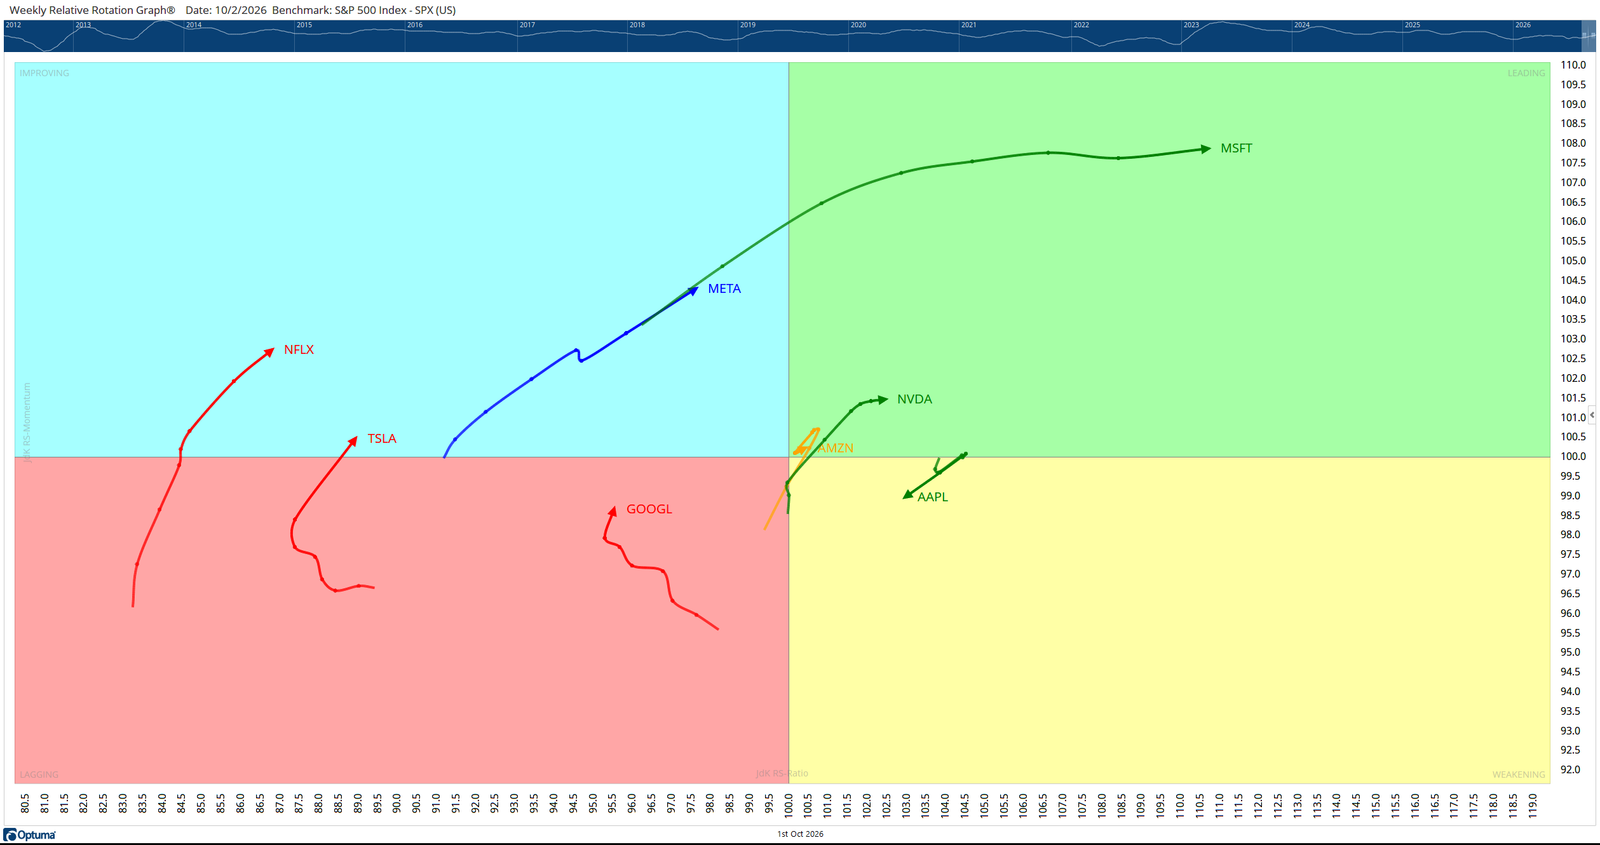
The mega-cap picture is fractured.

AAPL and GOOGL are still in the leading quadrant, though GOOGL's relative momentum is rolling over. NVDA and TSLA remain in weakening territory. AMZN is near the center, while MSFT, META and NFLX are still lagging.

What we are looking for: rotation to broaden from a small group of leaders into improving sectors and stocks. Until then, this remains a selective market. Rotation tells us where to look; structure and signal decide when to act.